

Pillar II: Our Commitment to the Environment
Material Topics
- Transition to lower carbon energy market
- Greenhouse gas emissions
- Energy use, energy efficiency
- Water management
- Effluent management
- Waste management
- Biodiversity
- Research and development, and innovation
![]()
![]()
![]()
Managing Our Emissions
We seek to reduce our emissions primarily by implementing best practices, continuously improving our operations, and investing in new technologies. We collaborate with industry partners to share best practices and develop and implement effective and meaningful emissions reduction strategies.
In the KRI, Pearl Petroleum is the only natural gas supplier to regional power stations. Through our Kurdistan Gas Project, Pearl is helping to meet the growing demand for energy in the KRI with cleaner-burning, affordable natural gas for electricity generation. Currently, natural gas accounts for more than 85% of total production from the Khor Mor plant, which has helped the KRG to avoid the use of expensive and higher carbon-emitting diesel for power generation.
Prior to 2021, our measurement of flaring at the Khor Mor gas plant was limited and more inferential. In 2020, we set in place plans to implement additional metering capabilities to improve flare measurement. Although delayed due to the COVD-19 pandemic, the initiative was completed in 2021. In addition, we developed a carbon emissions reduction strategy in 2021, by means of a Task Force to further improve emissions measurement, reductions and offsets.
Among these efforts included:
- Completing a review of flare related emissions metering and monitoring
- Creating a process to develop a comprehensive understanding of vehicle emissions
- Improving the measured accuracy of CO2 emissions
- Assessing options for the reduction of CO2 emissions
- Investigating future options for carbon offsetting
During 2021, we completed the installation of new meters and re-calibrated existing meters as we reviewed and revised all vents to the atmosphere from condensate and LPG equipment to deliver more accurate measurements. We have also commenced work to identify and record critical areas such as fugitive gas emissions from seals, valve stems, and flanges.
Our Scope 1 emissions comprise: (i) directly measured emissions emanating from flaring, the generation of electricity and steam, petrol and diesel consumed in our vehicles and camps and is based on industry standard conversion factors; and (ii) estimates for flaring, venting, and fugitive methane emissions, which have been identified during recently completed studies (and not included in previous sustainability reports).
As a result, in 2021 we reduced our Scope 1 emissions by 17% compared to 2020. Of the total, approximately 5% is attributable to the use of fuel gas for generating electric power to power the plant and local villages while the remainder is attributable to flaring, infrastructure and fugitive emissions.
In 2021, our Scope 2 emissions were attributed to the electricity consumed at our offices and warehouses in the UAE and Iraq. Similar to our Scope 1 emissions, we are working to improve our capabilities to accurately capture and report on our Scope 2 emissions.
Reducing Flaring
The flaring of natural gas is a controlled process for eliminating emissions of otherwise vented hydrocarbons, such as methane. In some cases, flaring is a necessary safety feature in normal operations within the oil and gas production process. We actively monitor and prioritise our efforts to minimise gas flaring at the Khor Mor plant and have progressively reduced flaring year on year.
Our Khor Mor plant is centred around a cryogenic LPG plant comprising two gas trains and an early production facility (EPF).
In 2021, we initiated Project Near Zero Flaring (NZF) at the Khor Mor plant, which included:
- Engaging with a specialist engineering consultancy to calculate and benchmark total CO2 and CO2e emissions from the plant to baseline performance.
- Re-routing condensate from the EPF condensate stabilizer to the main plant stabilizer.
- Commissioning process modifications to eliminate flash gas from the EPF produced condensate stabiliser and re-routing it back into the process, reducing GHG emissions by an estimated 61,600 tCO2e per year.
As a result, flaring from our Khor Mor plant in 2021 was 0.31% of the total raw gas processed, representing a significant decrease from the 0.45% recorded during 2019 and 2020. In all, we reduced total flaring of hydrocarbons by 28% between 2020 and 2021 following implementation of the process efficiency efforts outlined above.
For 2022, we are continuing to evaluate options to further reduce flaring, including potential flare gas recovery systems. We continue to strive towards further reductions in the coming years through continuous process optimisation, improved maintenance initiatives, and greater liquids recovery.
Our overall carbon emissions reduction efforts also include efficiency improvements within our facilities, including evaluating methods of minimizing emissions from the Khor Mor plant’s thermal oxidizer.
Carbon Offsets
As part of our continual drive to reduce our carbon intensity, in 2021 we offset our remaining carbon emissions, allowing us to become one of the first oil and gas companies to reach carbon neutrality. In 2021, we executed a contract with Ecosphere+ to offset an estimated 264,000 tCO2e emissions annually by purchasing carbon credits from two projects: (i) Datang Chifeng Danianzi Wind Farm and (ii) Salkhit Wind Farm project.
The Datang Chifeng Danianzi Wind Farm Project is located in China and Datang China-Japan (Chifeng) New Energy Co.,Ltd is the project owner. The project aims to generate electricity using wind resources and to sell generated electricity to the Northeast China Power Grid (hereafter NEPG), with an estimated emissions reduction of 150,424 tCO2e per year.
The Salkhit Wind Farm project is located about 70 km southeast of Mongolia’s capital Ulaanbaatar, and was developed by Clean Energy LLC (along with Swedish Energy Agency). The wind farm has a capacity of 49.6 MW and generates (net) 168.5 GWh of electricity per year, with an estimated emissions reduction of 178,778 tCO2e per year.
In the second half of 2021, there was a significant increase in nature-based carbon offset prices as the market matured and a growing number of companies and sectors adopted offsets as a decarbonisation strategy. We will continue to review and revise our offsetting strategy as needed to improve cost efficiencies.
Fugitive Emissions
In order to gain a more comprehensive understanding of emissions relating to flaring and fugitive emission leak points during 2021, we implemented a number of improvements:
- Conducted a metering study to identify waste gas and flare streams that were previously not monitored.
- Contracted with a third-party Leak Detection and Repair (LDAR) company; ‘The Sniffers’ to help identify fugitive emissions resulting from un-detectable leak points using state-of-the-art optical gas imaging (OGI). The company identified 42,350 leak sources associated with >65% of the process plant, equating to more than 102 tonnes of fugitive emissions per year (less than 0.1% of overall emissions). The remaining 35% of the process plant shall be surveyed during 2022.
- Installed ultrasonic meters on the LPG and EPF flare systems, which are used to measure overall flared volumes and identify variations in flared figures. The meters also help us determine internal leak points and equipment failures.
- Of the leak sources identified, resolution of leaks associated with 217 fugitive emission sources identified by ‘The Sniffers’ led to a substantial reduction in methane discharges, a reduction in potential major accident hazards and reduced workforce exposure to BTEX chemicals (i.e.: benzene, toluene, ethylbenzene and xylenes).
Mitigation work is ongoing and we continue to evaluate ways to further reduce fugitive emissions, including the evaluation of new technology and further facility repairs and enhancements.
| Key Performance Indicator (KPI) GHG Emissions |
Units | 2019 | 2020 | 2021 |
| Total flared hydrocarbons | tonnes | 18,112 | 18,775 | 13,591 |
| Flared hydrocarbon intensity | kg/ BOE produced | 0.50 | 0.50 | 0.35 |
| Methane emissions | tonnes | * | * | 58.1 |
| Volatile Organic Compounds (VOC) emissions | tonnes | * | * | 24.8 |
| Gas flared as percentage of production | tonnes | 0.45% | 0.45% | 0.31% |
| Direct GHG emissions (Scope 1) | tonnes of CO2eq | 352,221 | 295,553 | 246,929 |
| Indirect GHG emissions (Scope 2) | tonnes of CO2eq | 956 | 782 | 509 |
| Total GHG emissions | tonnes of CO2eq | 353,177 | 296,335 | 247,438 |
| GHG emissions intensity (Scope 1) (Carbon Intensity) | KG of CO2eq/ BOE produced | 9.70 | 7.93 | 6.29 |
| GHG emissions intensity (Scope 1 & 2) (Carbon Intensity) | KG of CO2eq/ BOE produced | 9.72 | 7.95 | 6.30 |
* Data not available during this period
Energy Consumption
We monitor our annual energy consumption to assess our environmental impact and to identify opportunities to reduce our energy intensity. After a 46% decrease in our direct energy consumption between 2019 and 2020, energy consumption remained flat between 2020 and 2021. Indirect energy consumption, representing the electricity and steam produced by Crescent Petroleum, was 1,175,068 kWh in 2021. Encouragingly, Crescent Petroleum’s energy intensity during 2021 was 22.76 kWh per BOE produced, which is approximately 5% below the Middle Eastern average of 24 kWh/ BOE.
We continue to evaluate options to utilize more renewable energy sources to reduce our overall carbon intensity. We are studying the feasibility of installing photovoltaic arrays in our new infrastructure projects to sustainably generate 20% of our power needs, as well as to move towards the use of electric vehicles at Khor Mor.
Separately we are working to improve our overall energy efficiency in other ways:
- All lights are switched off after working hours.
- Non-critical IT equipment switched off after working hours.
- All laptops have energy star ratings.
- Reducing travel when possible by using alternative communication tools like video conferencing.
- Leveraging SSD hard disks, which consume less power, in all laptops.
- Using cloud network where possible to reduce energy consumption in servers.
We also continue to seek ways of reducing energy consumption further by encouraging greater attention to such consumption in all activities.
| Key Performance Indicator (KPI) Direct energy consumption |
Units | 2019 | 2020 | 2021 |
| Petrol consumption from operations and vehicles | L | 456,004 | 261,815 | 270,673 |
| Diesel consumption from operations and vehicles | L | 369,140 | 186,900 | 180,025 |
| Fuel gas | MMscf | 2,229 | 2,480 | 2,920 |
| Total energy consumption | GJ | 2,465,488 | 2,726,863 | 3,211,455 |
| Total energy consumption intensity | GJ/ BOE produced | 0.07 | 0.07 | 0.08 |
| Total energy consumption intensity | kWh/ BOE produced | 18.85 | 20.33 | 22.73 |
Managing Natural Resources
| Key Performance Indicator (KPI) Direct energy consumption |
Units | 2019 | 2020 | 2021 |
| Total water consumption in water-stressed areas | m3 | 96,956 | 100,653 | 121,030.5 |
| Water consumption intensity | m3/ BOE produced (‘000) | 2.67 | 2.70 | 3.09 |
| Total volume of wastewater generated | m3 | 8,961.58 | 8,846.52 | 9,094.17 |
Waste
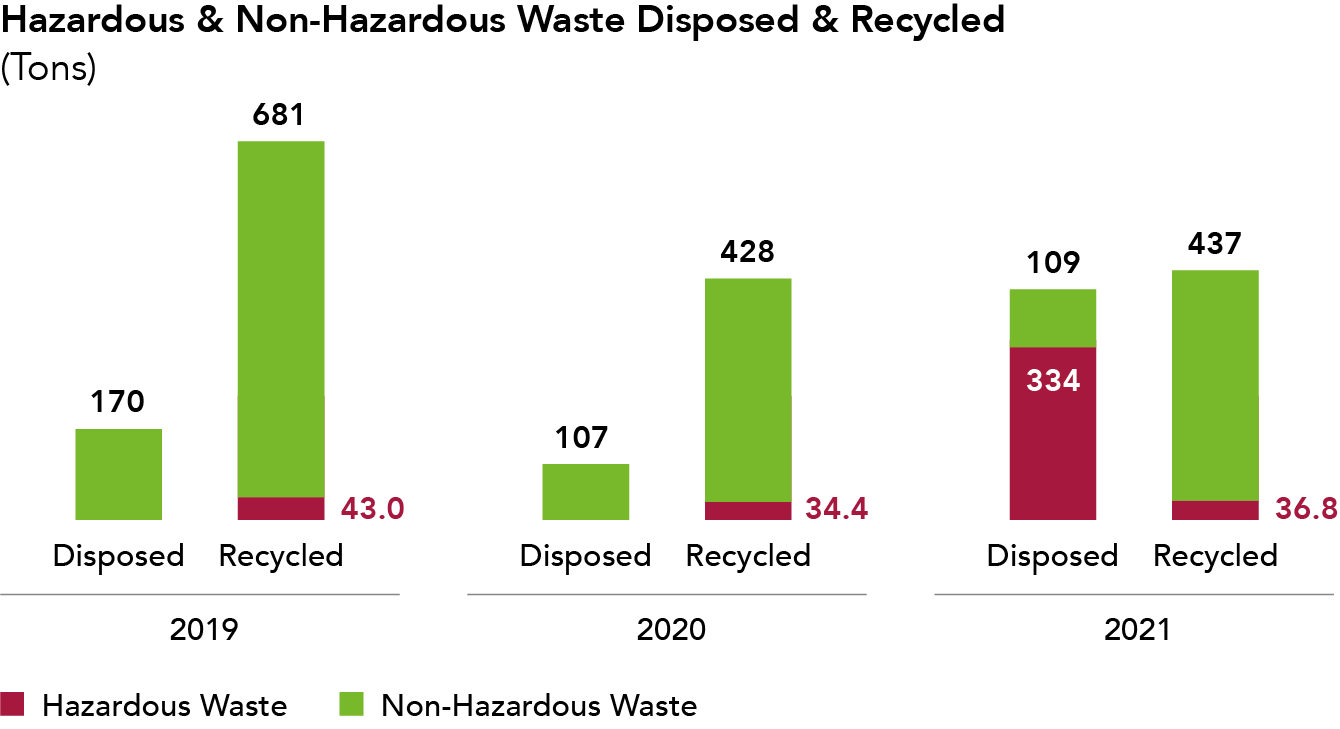
The proper management of non-hazardous and hazardous waste from our operations helps mitigate our environmental impact, promotes safe operations, and protects human health and safety. The non-hazardous waste we generate ranges from paper, food, glass, tires, scrap metal, wood and plastics.
Hazardous waste produced at the plant includes used filters, medical waste, waste oil, lubricants, batteries and e-waste. In 2021, 334 tonnes of hazardous waste resulted from an abnormal build up in our evaporation pond, stemming from a reduction in oil skimming and decanting activities used for recycling purposes. In the KRI, both types of waste are either incinerated or sent to approved recycling facilities and/or a landfill.
Other ways we are currently seeking to reduce our waste generation include enhancing waste management guidance, exploring waste assurance processes to monitor waste volumes, and assessing options to compost organic waste and to purchase a plastic or carboard baler.
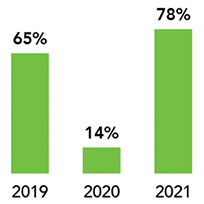
We intend to reduce waste at the source through increased recycling and reuse of resources. Compared to 2020, our recycling of non-hazardous and hazardous waste increased by 2% and 7%, respectively. To help further reduce our e-waste, we engaged with E-Scrappy, a third-party certified recycling company located in the region, to recycle our e-waste. While most office staff worked from home for six months during 2021, we were able to recycle more than 467 kgs of e-waste. We also increased the number of employees at Crescent who utilize e-signatures for contract signing to 100% in all our offices.
In recognition of these recycling efforts, we were singled out as one of the top five companies in the Middle East Waste and Recycling Award, dedicated awards for the waste and recycling industry.
| Key Performance Indicator (KPI) Direct energy consumption |
Units | 2019 | 2020 | 2021 |
| Total hazardous waste disposed | Tons | 0 | 0 | 334 |
| Total hazardous waste recycled | Tons | 43.0 | 34.4 | 36.8 |
| Total non-hazardous waste disposed | Tons | 170 | 107 | 109 |
| Total non-hazardous waste recycled | Tons | 681 | 428 | 437 |
Reducing and Responding to Spills
Numerous measures are in place across our operations to prevent unnecessary releases to the environment. We prepare and maintain spill prevention and management plans at all our locations and have a dedicated team in place to respond in the event of an incident.
We also track, record, and determine the cause of any oil, produced water, or other spill or release. This allows us to identify trends to mitigate issues and take steps to prevent future releases.
In 2021, we had a total of eight hydrocarbon spills, zero deemed significant, six of them amounting to less than one barrel in volume, and the remaining two amounting to between one to ten barrels.
Additional ways we plan to mitigate spills and prevent contamination include:
- Identifying and confirming sources of contamination, especially for water wells.
- Establishing boundary monitoring wells to identify and determine any contamination arising from condensate storage and loading areas.
- Conducting onsite bunding reviews.
| Key Performance Indicator (KPI) Direct energy consumption |
Units | 2019 | 2020 | 2021 |
| Hydrocarbon spills | # | – | – | 8 |
Case Study: Enhancing Waste Management Practices
To dramatically reduce the waste sent to landfills, we invested into our Khor Mor waste management infrastructure in 2021, including procuring an incinerator, waste delivery truck and fabricated waste skips at strategic locations throughout our operations to control waste. We subsequently developed an associated waste management program, which defined operationally appropriate waste streams and incorporated training for the incinerator operators and technicians.
After successfully installing and commissioning the incinerator and its related operations, we were able to accelerate our overall waste management practices by addressing the growing volumes of single use plastic caused by COVID-19’s hygiene restrictions, and further reduced the waste sent to landfills from the KM250 project.
| Description | Volume (KG) |
| Waste collected (indicative) | 46,066 |
| Waste reused (indicative) | 10,694 |
| Waste recycled (indicative) | 4,476 |
In the future, we aim to expand the various types of waste processed by the incinerator to expand the throughput.